If you’re already an expert on financial statements, and can fully understand any business just by looking at its accounting documents, great! You can skip this blog post. But if you’re looking to improve your understanding of financial statements, I hope you’ll find this to be a good introduction.
So, what do I mean by the Big Three? I’m talking about the three most used and most useful documents: the Profit and Loss Statement (P&L), also called the Income Statement, the Balance Sheet, and the Cash Flow Statement.
The Profit and Loss Statement (P&L) or Income Statement
The P&L is the easiest of the three to understand – it uses financial data to tell the story of the business over a period of time, usually a month, quarter, or a year. Here is an example P&L for a fictional business in August 2021:

This is telling us how much was invoiced during the month (revenue), and how much cost was incurred, both direct costs (or cost of sales, which tend to increase or decrease with revenue) and indirect costs (administrative and other, which usually stay constant from month to month). It’s clear why this is so important – looking at this, we can instantly see how profitable the business was that month, and what its largest cost items were.
In our experience, many business owners tend to focus on their revenue, or ‘top-line’. Of course, the business coming in the front door is important, but it is just on of many metrics. There’s a saying:
Revenue is vanity, profit is sanity, and cash is king
It doesn’t matter how high your revenue is, if your costs are higher! And even if profits are high, that doesn’t necessarily mean you can withdraw them as dividends – please read our other post for more details.
So, the P&L doesn’t tell us everything about the business – it doesn’t even tell us everything about the business’s activity for that month. For example, looking just at the P&L we have no idea if the business bought or sold capital equipment during the period, or how much cash it has in the bank. For this and more, we need to look at:
The Balance Sheet

Unlike the P&L, which always looks at a defined period (a month, in the above example) the Balance Sheet is a snapshot of assets (everything a business owns), liabilities (what it owes) and equity taken at one point in time – usually the month end or year end. It’s called a Balance Sheet because the amounts will always balance according to the accounting equation:
ASSETS – LIABILITIES = EQUITY
This is absolutely non-negotiable – if the net assets on a balance sheet do not equal the equity, something has gone catastrophically wrong! The balance is maintained by double-entry bookkeeping, which we will discuss later, but let’s talk about assets and liabilities first.
Fixed Assets
This is all the equipment a business owns and uses to generate profit – this will include computers, cars and smartphones purchased by the business and used by employees, as well as any machinery that has a useful life of several years or more. The cost of these assets does not appear on the P&L when they are purchased, but instead the assets are depreciated over time, until at the end of their useful life they are depreciated to a value of 0. The depreciation charge is shown on the P&L – in this way, the cost is correctly spread over the life of the assets.
Current Assets
Current assets are expected to be converted to cash within the year – cash itself is also included in this category. A typical business could have in its current assets:
- Cash in bank and in hand (such as a petty cash fund)
- Accounts receivable – this is the amount that has been invoiced to customers but not yet paid
- Accrued income – if goods or services have been provided to customers but not yet invoiced, the value of these would be listed here
- Prepayments – any payments in advance that the business has made to its suppliers
Non-current Assets
These would be longer-term assets – such as a loan issued to another business (or an individual) that has a repayment term of over a year.
Liabilities are the flip-side of assets and show what the business owes – like assets, they are split into current (which are expected to be paid within a year) and non-current (longer term).
Current Liabilities
These will include any or all of the below, and more:
- Credit card balances
- Accounts payable – bills received by the business and not yet paid
- Accrued costs – for goods or services received which have not yet been billed
- VAT owed to HMRC, if the business is VAT-registered (if instead HMRC owes VAT to the business, this would be listed under Current Assets)
- Provisions for expected costs, such as corporation tax
Non-current Liabilities
The main items here are usually long-term loans that the business has taken out, but there will sometimes be long-term provisions here as well.
Equity
This is essentially the value of the company, which is why it is equal to net assets (assets minus liabilities). For a small, young business, the main items included here are:
- Share capital – the cash paid when the shareholders bought their shares. This will usually be a nominal amount and wholly unrelated to the present-day value of the shares
- Retained Earnings – this is all the profit (after tax) that the business has made in its lifetime. Often this is split between current year earnings and prior retained earnings
- Dividends paid (negative) – this is the amount of retained earnings that have been paid out to shareholders as dividends, again for the full lifetime of the business
A note on available reserves
As we talked about in the P&L section above, many business owners have made the mistake of thinking they can withdraw all the profits their business makes. This is not true! A business’s operating profit is NOT the same as its available reserves.
The business’s available reserves can be found on the balance sheet – it is the amount of profit, AFTER tax and all other costs, that the business has made in its lifetime, minus all dividends distributed (if any) in its lifetime too. For example, imagine your business made a £20k loss in its first year, but a £50k profit after tax in year 2. As the owner, you’d be rightfully proud and delighted with your £50k profit, but if you immediately issued yourself a £50k dividend you can get into big trouble. Only £30k was available for distribution – the remainder is not considered a dividend by HMRC but a director’s loan, which has highly punitive tax implications for both the business and you personally.
Going back to the balance sheet as a whole – at every point in time, without exception, the accounting equation “Assets minus Liabilities equals Equity” always holds true, whatever happens. This is achieved through double-entry bookkeeping – if you already know what this is, feel free to skip to the cash flow statement, but if not:
What is double-entry bookkeeping, and how does it work?
The principle of double-entry bookkeeping is very straightforward:
- Every entry of new information into the financial statements is done by a double-entry journal
- Journals add to (or subtract from) the amounts shown in PnL income, PnL expenses, Balance Sheet assets, and/or Balance Sheet liabilities, by debiting or crediting specific items (such as Marketing Expense or Accounts Payable liability
- In every journal, debits = credits. (Debit is written DR, credit CR)
For example: a business uses a marketing agency, who sends the business a bill for £120. To record that bill, we create a journal that looks like this:

Maybe that bill is actually £100 plus £20 VAT, and our business is VAT-registered, in which case the journal would be:

Notice that the total amount of debits always equals the total credits.
When we enter that journal into our accounting software (whatever we are using) this journal will change the business’s PnL and balance sheet so that the new bill is correctly recorded, like so:
Notice that the total amount of debits always equals the total credits.
When we enter that journal into our accounting software (whatever we are using) this journal will change the business’s PnL and balance sheet so that the new bill is correctly recorded, like so:


Later, when we have actually paid the bill, we will need another journal to show that it is paid and make sure it is no longer included in Accounts Payable – that journal will look like this:

This journal won’t affect the P&L, as payments of recorded bills don’t, but the effect on the balance sheet will be:

Notice that the Accounts Payable amount was credited in the first journal (when we received the bill) and debited in the second (when it was paid) – the liability was added in the first and removed in the second. If you want to know which way round to put your debits and credits, remember the phrase DEAD CLIC:
Debit – increases Expenses, Assets, and Drawings
Credit – increases Liabilities, Income and Capital
Luckily, most accounting software these days is much simpler and will do the double-entry in the background for you as you enter bills, reconcile bank transactions etc. But the principles remain the same, so even though you’re unlikely to have to post journals (your accountant will usually do this for you when needed) it’s still good to understand how it works.
Cash flow statement
Between them, the P&L and the balance sheet show almost all the relevant information about a business. But as all business owners know, Cash is King! It’s crucial to keep track of your cash income and outgoings just as much as your P&L – nobody wants to find their account overdrawn the day a large bill is due, and have to pay fines or interest costs as a result. Monitoring the cash flow statement can highlight where problems are occurring.
Cash flow statements, like the PnL, show a story of a period, and how the business’s balance sheet has changed in that time period. Here is a typical, traditional cash flow statement (this example is for a month):

The business has made a profit but still had a net outflow of cash – as you can see, profit (or loss) is just one part of the cash flow story. In this example, the other relevant items are:
- Add back depreciation – as discussed above, this is the amount the fixed assets have devalued in this period and was included as a deduction in the profit. As this wasn’t an actual cash cost, this is added back.
- Fixed Asset purchases – cash spent on buying new fixed assets
- Movement in Debtors – the change in the amount of Accounts Receivable. As you can see in the balance sheet, this amount has increased in the month – there are more unpaid invoices, which means less cash has been received than was included in the month’s profit
- Movement in Creditors – the change in the amount of Accounts Payable. This amount has decreased in the month, meaning the business has paid more of its bills and debts than is included in the month’s profit, which means less cash
- Movement in VAT – VAT is another creditor, like Accounts Payable, but the movement is in the other direction so this is cash-positive
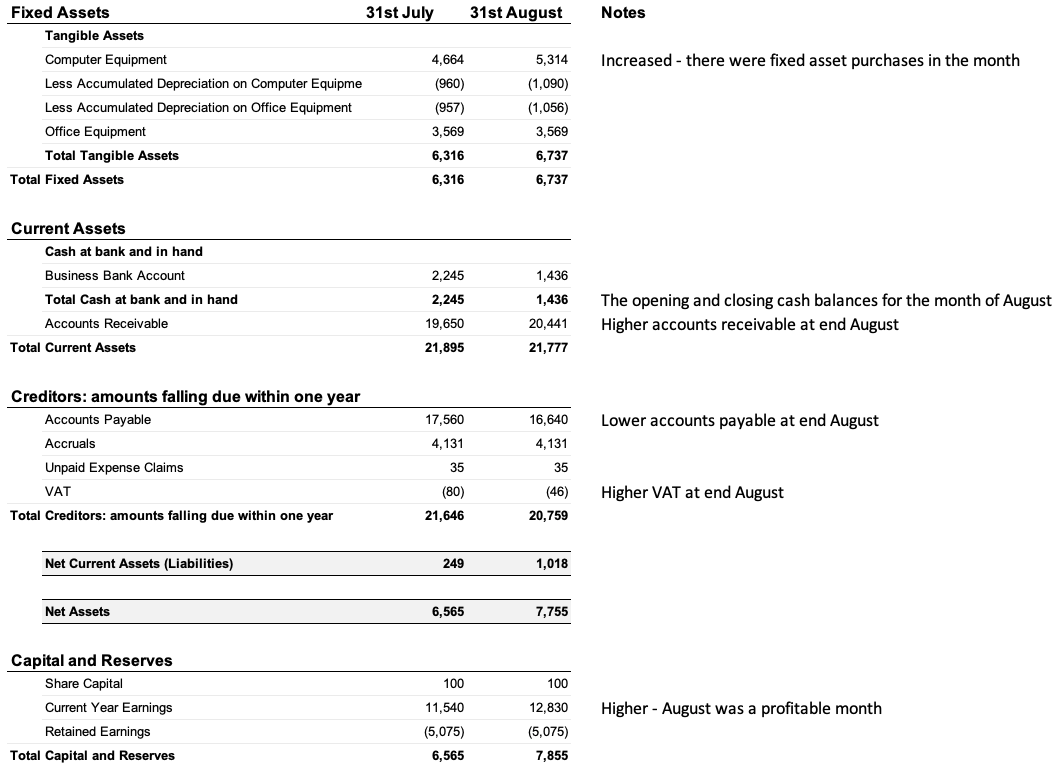
All of the cash flow items can be deduced by looking at the balance sheet at the beginning and end of the period in question – here is what the balance sheet looked like at the beginning and end of the month:
Summary
Between them, these three documents can tell you everything you need to know about the business you’re looking at – whether you’re the owner, or a potential investor or lender. You can see the story of the business activities described in the PnL, the value of the business’s assets in the Balance Sheet, and the cash flow statement shows the income and outgoings in even more detail.
I hope this quick tour of the Big Three has been helpful, but feel free to get in contact with us if you’d like to know more – we love to talk about numbers, and how detailed accurate reporting can benefit every business!